SignUp
Login
10
Latest Videos
53.5K
23:00
CS606_Lecture45
53.5K
23:00
CS606_Lecture44
53.5K
23:00
CS606_Lecture43
53.5K
23:00
CS606_Lecture42
53.5K
23:00
CS606_Lecture41
53.5K
23:00
CS606_Lecture40
53.5K
23:00
CS606_Lecture39
53.5K
23:00
CS606_Lecture38
53.5K
23:00
CS606_Lecture37
53.5K
23:00
CS606_Lecture36
Search
Night mode
Sign In
Sing Up
Please Wait
Click Here To Watch
K views
Upnext
20.2K
23:00
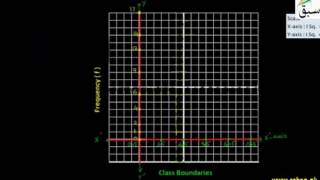
Graph of Frequency Distribution by Histogram
20.2K
23:00
Problem 1: Constructing Histogram with Equal Intervals
20.2K
23:00
Cumulative Frequency Distribution
20.2K
23:00
Find the Cumulative Frequency
20.2K
23:00
Construct a Cumulative Frequency Polygon for the Given Data or Ogive
20.2K
23:00
Construct a Cumulative Frequency Polygon for the Given Data (Ogive)
23.7K
23:00
Data
23.7K
23:00
Exploring Data
23.7K
23:00
Interpretation of Data
23.7K
23:00
Introducing Parameters and Statistic
23.7K
23:00
Basic Terminologies in Statistics
23.7K
23:00
Accuracy of Measurements & Errors
23.7K
23:00
Qualitative/Quantitative Data
23.7K
23:00
Types of Data(Continuous/Discrete)
23.8K
23:00
Construction of Continuous Frequency Table
23.8K
23:00
Problem 1: Construction of Continuous Frequency Table
23.8K
23:00
Construction of Discrete Frequency Table
23.8K
23:00
Charts/Diagrams
23.8K
23:00
Graphical Representation of Data-Horizontal/Vertical Bar Graph
23.8K
23:00
Graphical Representation & Interpretation of Data-Multiple Bar Graph
23.8K
23:00
Component Bar Chart
23.8K
23:00
Percentage Component Bar Chart
23.8K
23:00
Composite Bar Chart
23.8K
23:00
Graphical Representation & Interpretation of Data- Pie Graph
23.8K
23:00
Graphs
23.8K
23:00
Interpretation of Data Through Graphs
23.8K
23:00
Graphical Representation & Interpretation of Data-Dot Graph
23.8K
23:00
Graphical Representation & Interpretation of Data- Line Graph
23.8K
23:00
Graph of Time Series
23.8K
23:00
Common Shapes of Frequency Curves
23.8K
23:00
Positively Skewed Frequency Curves
23.8K
23:00
Negatively Skewed Frequency Curves
28.8K
23:00
Pictograms